Video Tutorial - LMK LabSoft - Series LMK5 and LMK6
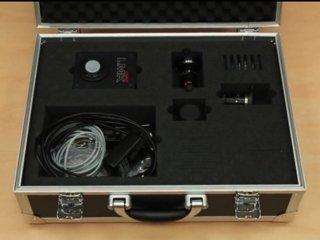
Unboxing and Installation
This video answers first questions when receiving an LMK instrument
- Which components the LMK system is consisting of
- Which basic settings need to be done onto the measurement PC
- First test of functionality
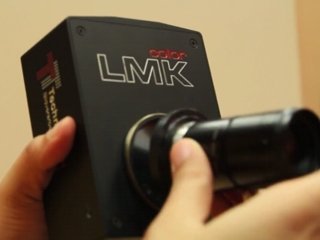
Preparing Measures - Mounting Interchangeable Lenses
This video introduces into the use of interchangeable lenses:
- How is the LMK system being connected electrically
- How are the interchangeable lenses being mounted
- Selecting the correct calibration data set into the measurement software
- Using the informtion of the focus setting to adapt the calibration data
Preparing Measures - Orientation and Correct Focussing
The correct setting of the focus is essential to obtain correct results when using the LMK measurement instruments.
- Options to change lens settings
- Effect of blur into images out of focus
- Adapting the focus settings into measurement software
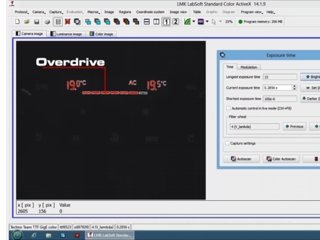
Measurement - Selecting the Correct Measurement Range
LMK Systems can be used to capture extreme high dynamic in luminance (e.g. over 0,05 cd/m² to 10 Gcd/m²). The video presents options to adapt the systems sensitivity:
- Manual selecion of measurement range (exposure time)
- Continuous auto-ranging (exposure time)
- One-time auto-ranging (Autoscan)
- Using neutral density filters
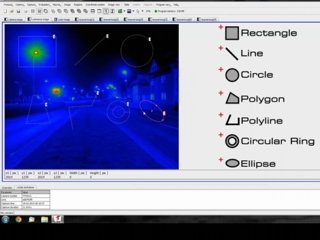
Analysis and Reporting - Working with Measurement Regions
Geometrical regions surrounding into images areas of interest which are used to readout data and report them. The video presents the possibilties to generate, move, copy, adapt group and delete measurement regions. Measurement regions are:
- Rectangles, Circles and Ellipses
- Lines and Polylines
- Polygones
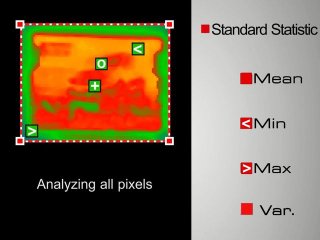
Analysis and Reporting - Using Data of Standard Statistics
The feature Standard Statistic is used to obtain general statistical data of regions content. Regions are initially just geometrical drawn shapes before a statistical evaluation is being assigned. The video presents how the Standard Statistic is assigned and which data can be obtained:
- Standard Statistic - Average Value
- Standard Statistic - Minimum and Maximum Value
- Standard Statistic - Geometrical and Photometrical Center
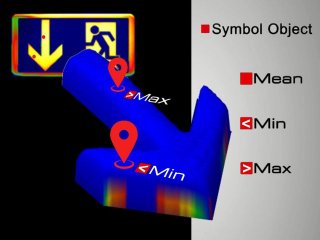
Analysis and Reporting - Using Symbol Objects for lit areas
The feature Symbol Object Statistic is used to obtain statistical data only of lit parts of a regions content. The video presents how the Symbol Object Statistic is assigned and which data can be obtained:
- Asigning the statistical method to regions
- Visual feedback for recognized lit areas
- Additionally parameters
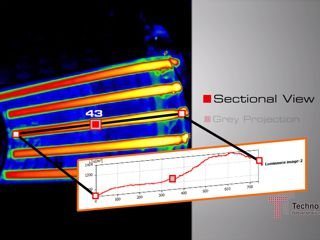
Analysis and Reporting - Using Luminance profiles along lines
The feature Sectional View provides analysis of luminance profiles along lines and outlines of area types of regions. The video presents the options of luminance profiles:
- Region types available for this feature
- Difference between sectional view and projection
- Additionally parameters
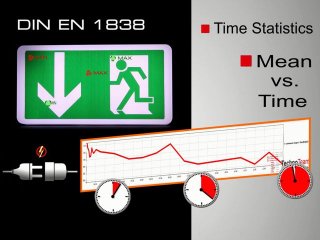
Analysis and Reporting - Time dependent behaviour of Luminance
The feature Time Statistics offers analysis of various measurement data along timelines. The analysis of emergency signs acc. DIN EN 1838 is a good example presented within this video:
- Requirements acc. DIN EN 1838
- Setting up for time statistic analysis
- Additionally parameters
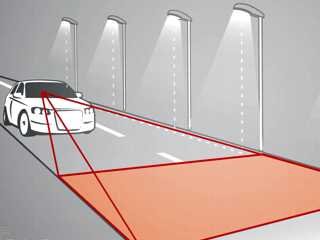
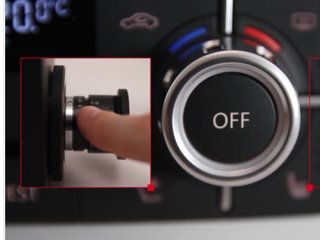
Example Application - EN 13201 Analysis of Road Illumination
The standard DIN EN 13201 specifies how luminance, homogeneity and glare parameters are to be analyzed for characterization of road illumination.
The video shows the use of the LMK and the specific LMK LabSoft Add-on software:
- Setting up the LMK camera into a car
- Orientation of LMK and capturing using measurement series
- Loading data of measurement series into LabSoft
- Specify geometrical details of the scene for the use into LabSoft
- Evaluation of parameters Uo, Ul, TI and other
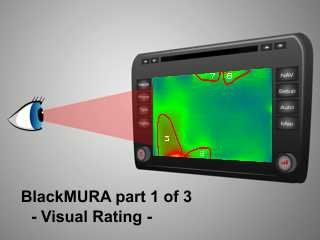
Example Application - BlackMURA part 1: Visual Rating
The analysis of display screen quality according to the Automotive OEM workgroup BlackMURA standard of the DFF is based onto visual ratings of local and global non-uniformities.
Into the video, the background of visual perception is being discussed:
- How do non-uniformities appear visually
- Using spatial frequencies into perception models
- Options to rate global and local non-uniformities
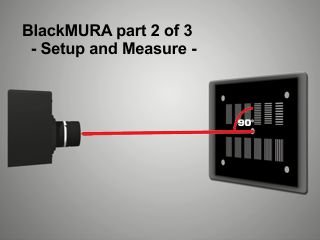
Example Application - BlackMURA part 2: Setup and Measurement
Specific issues need to be considered for measurements of display according to the Automotive OEM workgroup BlackMURA standard of the DFF.
The video shows the optical setup and measurement process including:
- Geometrical alignment of the display vs. LMK
- Focus alignment
- Spectral matching to V(lambda)
- Considering angular dependency of display luminance
- Temporal stability

Webinar Video - Reproduzierbare Display Sparkle Messungen mit LMK-Systemen
The evaluation of Display Sparkle Effects is critical especially from the point of view of reproducibility and comparibility between different laboratories.
Fundamentals of the evaluation of Display Sparkle are being presented as well as the requirements of the measurement setup are being discussed:
- Introduction and defination of Display Sparkle
- Separierung of Sparkle from other display effects
- Problem of reproducibility and solutions
- Measurement setup and requirements for the configuration of LMK Systems
- Influence of defects and contamination of display surfaces and materials